June market update

June market update
8 Jul 2021
Here's the low down on why June was another record-breaking month, the forces that have dictated market performance over the first half of 2021, and why Europe, Emerging Markets, and NZ are all under-performing.
June market update
It’s another month of records! After a slow start, towards the end of the month the market accelerated, with the US markets setting 7 consecutive records in a row and both US and global markets finishing the month at all-time highs. This was all driven by:
- Increasing confidence that central banks will keep rates low into the medium term;
- Ongoing reopening (after lockdowns) which continues to drive economic growth at unprecedented levels; and
- Record corporate earnings growth as earnings rebound to levels significantly higher than pre-pandemic levels
Seeing as we’ve hit the 6-month mark for 2021, rather than our normal monthly market update approach where we breakdown what’s happened in each region, first we’re going to take stock and look at why the markets are moving the way they are and what some of the driving forces for the next 6 months may be.
Jargon translation: When we talk about generic markets, we’re usually referring to the US which makes up almost 60% of global market capitalisation (market cap = the market value of publicly-traded company’s) which is the key driver of trends and activities.
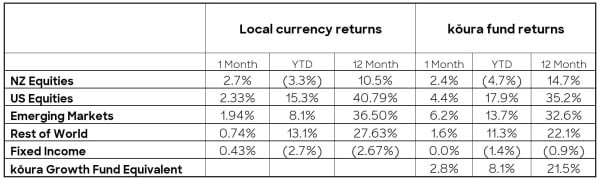
[1] Kōura Growth Fund based on a typical 80:20 mix, NZ Equities 20%, US Equities 35.4% Emerging Markets 8.4%, Rest of World Equities 16.2%, Fixed Income 20%
2021 market forces to date
1. Low interest rates (that will likely stay low for longer)
There is a growing consensus among market participants that:
- The current inflation we’re seeing is likely to be “transitory” and a result of the reopening of global economies and people spending up the money saved while being locked down, rather than something more permanent in the economy; and
- The US Federal Reserve (who realistically drive global interest rates) are a long way away from being prepared to lift interest rates. They have consistently said they want to see the economy return to full employment before raising interest rates. The latest June US job numbers show that while new jobs are being created, there are still 4.5% fewer jobs than pre-pandemic times, and unemployment has actually increased slightly over the past month. So, until unemployment looks like it’s trending downward, interest rates are likely to stay where they are.
These two factors have driven long-term interest rates lower over the past few months (because the biggest driver of interest rates is inflation expectations). 10-year US treasury bond yields have fallen 17% from their peak in March 2021 and now have a yield of 1.43%.
This lowering of longer-term interest rate assumptions has driven significant growth in the high-growth US tech stocks which are up 6.5% over the past 3 months compared with a return of only 1.8% for the everyday main-street orientated Russell 2000 index.
Jargon translation: Bond yields = the interest rate for bonds. So, if you invested in US Treasury bonds 4-6 months ago you’d receive a higher return than if you invested now at the current 1.43% yield.
The Russell 2000 index is more representative of everyday companies (AKA small-capitalisation companies) rather than big multi-nationals (AKA large-capitalisation companies) like other market indexes (e.g., the S&P 500). So, over the past 3 months, your money would’ve had a higher return being in big US tech companies, rather than small-cap companies.
2. Record economic growth from post-pandemic bounce back
Global economic growth has not been this good since the end of World War 2. Economic growth forecasts continue to be updated as countries rebound faster than initially expected.
In the table below, you can see that economic expectations have grown rapidly since the start of the year, and that has driven significant earnings growth.
2021 Real GDP Growth estimates
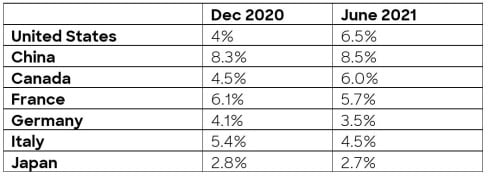
Interestingly you can see those countries that have done well in combating the virus and rolling out vaccines have had significant upswings in growth compared to those countries that are struggling to control the virus (Europe and Japan).
Jargon translation:
1. GDP = Gross domestic product. Put simply, GDP is the value of all goods and services a country produces, minus the cost of producing them. It’s commonly used to measure the size of an economy.
2. Understanding the Real GDP table. E.g. At the end of 2020, experts estimated the US economy would grow 4% during 2021. If GDP at the end of 2020 was $20.93 trillion, then by the end of 2021 it should increase 4% to $21.76 trillion. In reality, it’s now expected to grow 6.5% (ending 2021 at $22.29T). That essentially means 2.5% (or $530B) more money floating around in the US economy than initially predicted.
3. Record corporate earnings
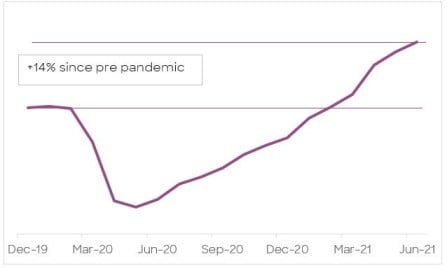
Corporate earnings in the US have taken off faster than ever could have been anticipated. 1 year forward earnings are already 14% higher than pre-pandemic and have grown by 10% over the past 3 months. As earnings grow, companies get cheaper on a relative basis, and generally that means people will now be more willing to pay more for shares in those companies (so share markets go up).
Jargon translation: When you buy shares in a company, you’re buying a tiny part of the company’s future earnings. So, if the company’s future earnings are now expected to be higher than originally thought, people are willing to pay more for those shares because the increased cost of the shares becomes somewhat outweighed by the increase in dividend yield (the amount you’ll be paid out per share). Essentially, you’ll spend more to buy the shares, but also expect to be paid out a higher amount come dividend payment time.
2021 Earnings per share estimates for the S&P500
Market summary by region
Europe’s under-performing. Will it be a perpetual laggard?
It’s a great question. Since the GFC investors have continually bet on a European recovery and have been disappointed. 3 months ago, Europe (represented by the rest of world in Table 1 above) was seen as the next strong area for investment, though their stock markets have underperformed as they have grappled with ongoing covid outbreaks and a market that is structurally orientated to the old world rather than the new world.
Contrary to the rest of the world, European economic growth expectations have fallen over the past 6 months. This is not helped by a stock market that has a large weighting to industrials, resources and financial stocks and a very low weighting to technology and the new economy that has driven a significant amount of the recent market performance in the US.
We’re not brave enough to say whether Europe will be a perpetual laggard, though we’re not willing to believe the market commentators who say a European recovery is just around the corner.
Emerging Markets are slow-growing, will that change by the end of 2021?
Over the past 6 months, the Emerging Markets (EM) have underperformed when compared to their global counterparts (yes even behind Europe). However, it’s important to put the last 6 months of underperformance into the context. Emerging markets performed extremely strongly in 2020 as a result of successfully fighting the pandemic and getting their economies off the ground, and so compared to last year’s results, 2021 is slow.
Given their success in fighting the pandemic, these countries have been slower to rollout their vaccine programs (a lack of urgency as people were not dying) which means their economies have not seen the same bounce as in other markets. At this point in the cycle, it appears that the US may have stronger growth prospects than China and other fast-growing Asian economies (an unheard-of prospect 6 months ago).
These economic concerns are exacerbated by concerns in China (which makes up 40% of the EM index) around an ongoing crackdown in the tech sector and the impact that US sanctions and blacklisting will have on companies.
Jargon translation: Emerging Markets are economies that are transitioning from being lower-income and less developed, towards a more modern, industrial economy with a higher standard of living.
There are many emerging markets, but as an example, some of the biggest are China, India, Indonesia, Mexico, Poland, South Africa, South Korea, Turkey, and Taiwan.
At a local level, NZ is doing just fine. So why are we behind globally?
The New Zealand economy seems to be going from strength to strength (driven by construction, agriculture, and property) though our market is a global laggard. On a 2-year basis, the NZX has delivered a return of only 10% per annum versus other markets pushing around the 20% mark. It’s hard to see what will drive the NZX to close this gap over the coming months.
ANZ and ASB Bank are predicting interest rate rises in the next 6 months, both of whom had previously predicted mid to late 2022 interest rate rises. This is off the back of our economy doing better than expected (though still not well enough to catch up to overseas markets) and inflation being on the rise.
The reasons the New Zealand market has performed so poorly are:
- Our once largest company A2 milk has fallen by almost 75%. New Zealand has a very highly concentrated market and at one point A2 Milk made up over 15% of the market, so this fall has a significant impact on the broader market.
- Our market is very sensitive to interest rates, we have one of the highest dividend-yielding markets in the world, so in a falling interest rate environment New Zealand is an attractive place to invest, though when interest rates rise (as they have done over the past 6 months) investors will look to return to fixed interest products; and
- The New Zealand market is highly concentrated and does not really reflect the wider, global economy. Our market is dominated by large infrastructure players and has very little technology or agriculture components, two areas that are doing well at the moment.
Jargon translation: Dividend yields = the amount a company pays out to investors relative to its’ share price. NZ has a market that generally pays high dividend yields (so investors are paid more per share when compared to shares they might hold in overseas companies).